
Complexity Made Simple
Hassle-free investment options. Investors can access comprehensive reports on their portfolio 24/7 anytime, anywhere through the AutoWealth platform. In addition to weekly commentaries, AutoWealth provides quarterly reports, timely portfolio performance and market updates.

Fully-managed
We have an investment team to help you fully manage your portfolio. Investors can sit back and relax while we do the work.

Robust portfolio construction
At AutoWealth, each portfolio construction process is designed to create a robust and diversified investment portfolio that maximizes returns while minimizing risk.

Stringent risk management
Our stringent risk management practices are designed to ensure that each investment portfolio is protected from market volatility and other risks.

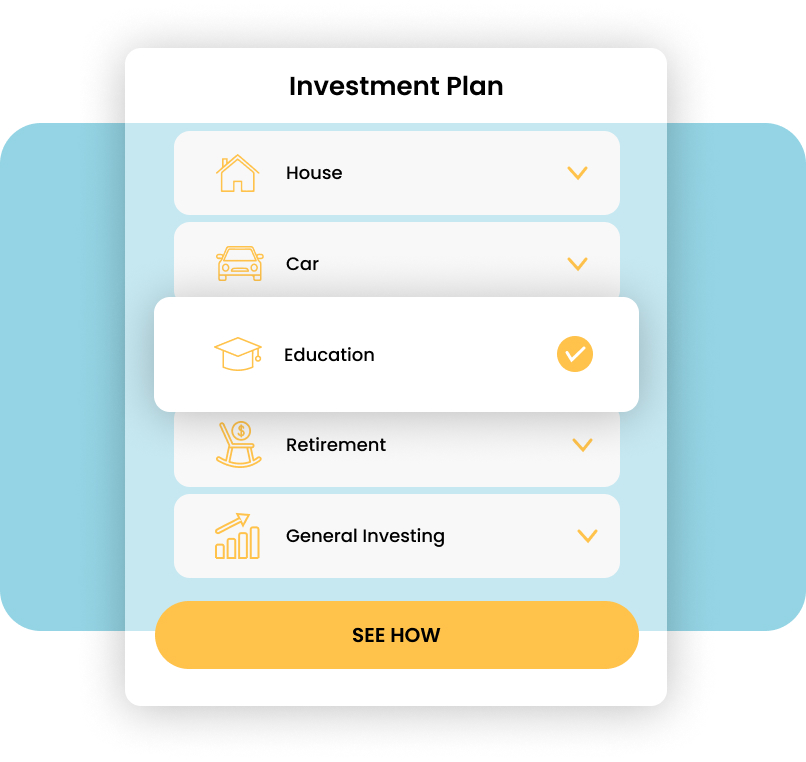
House
Investing in a home is one of the best decisions you could ever make. Find out how!

Car
Buy a car with an approximate down payment of your choice.

Education
Consider the academic goals your child has after he or she graduates high school.

Retirement
Enjoy life and finally take advantage of everything you've been working hard for.

General Investing
Set a smart goal for yourself to a fulfilling life ahead.